Susceptibility to multiple sclerosis follows a complex pattern with a clear genetic component, evidenced primarily by the relatively high recurrence risk in family members of affected individuals, and the frequent occurrence of MS in some ethnic populations, particularly those of north European origin.
Since 1996, more than a dozen family-based linkage and population-based genome wide association studies (GWAS) were conducted in MS. Our lab is a member of the International MS Genetics Consortium (IMSGC), which recently concluded the largest GWAS involving approximately 50,000 cases and 50,000 controls.
Altogether, these studies generated a wealth of data amenable for further mining using modern bioinformatics, including advanced statistics, pattern recognition, and artificial intelligence methodologies.
Some of our projects include:
GWAS of Disease Progression
We are leading an IMSGC project to identify common variants associated with disease progression in 5000 patients with MS. A replication cohort of similar size will be analyzed in collaboration with the MultipleMS Consortium.
Whole genome and exome sequencing: We hypothesize that rare pathogenic variants responsible for some symptoms of MS are enriched in patients with progressive forms of the disease. We use DNA sequencing technologies to investigate the role of these rare variants in specific subsets of patients.
RNAseq of Specific Cell Populations
Gene expression profiling is a powerful tool to understand the activation of cellular pathways and can be used to classify patients by severity, response to therapeutic drugs or disease subtype. We employ a variety of techniques to interrogate gene expression from blood, brain, and other cells or tissues of interest. Cell-type specific transcriptomics is crucial for understanding biological process and disease pathogenesis since diverse type of cells participated in different pathways. Specifically, we study transcriptome of CD4+, CD8+ T cells, and CD14+ monocyte from early-stage MS patients. The results from this research will provide important insights about the molecular mechanisms that regulate emergence of the disease, and enable future studies directed toward the development of novel and personalized therapeutic strategies to better manage this devastating disease.
Following are visual gene expressions profiling blood cells from multiple sclerosis patients:
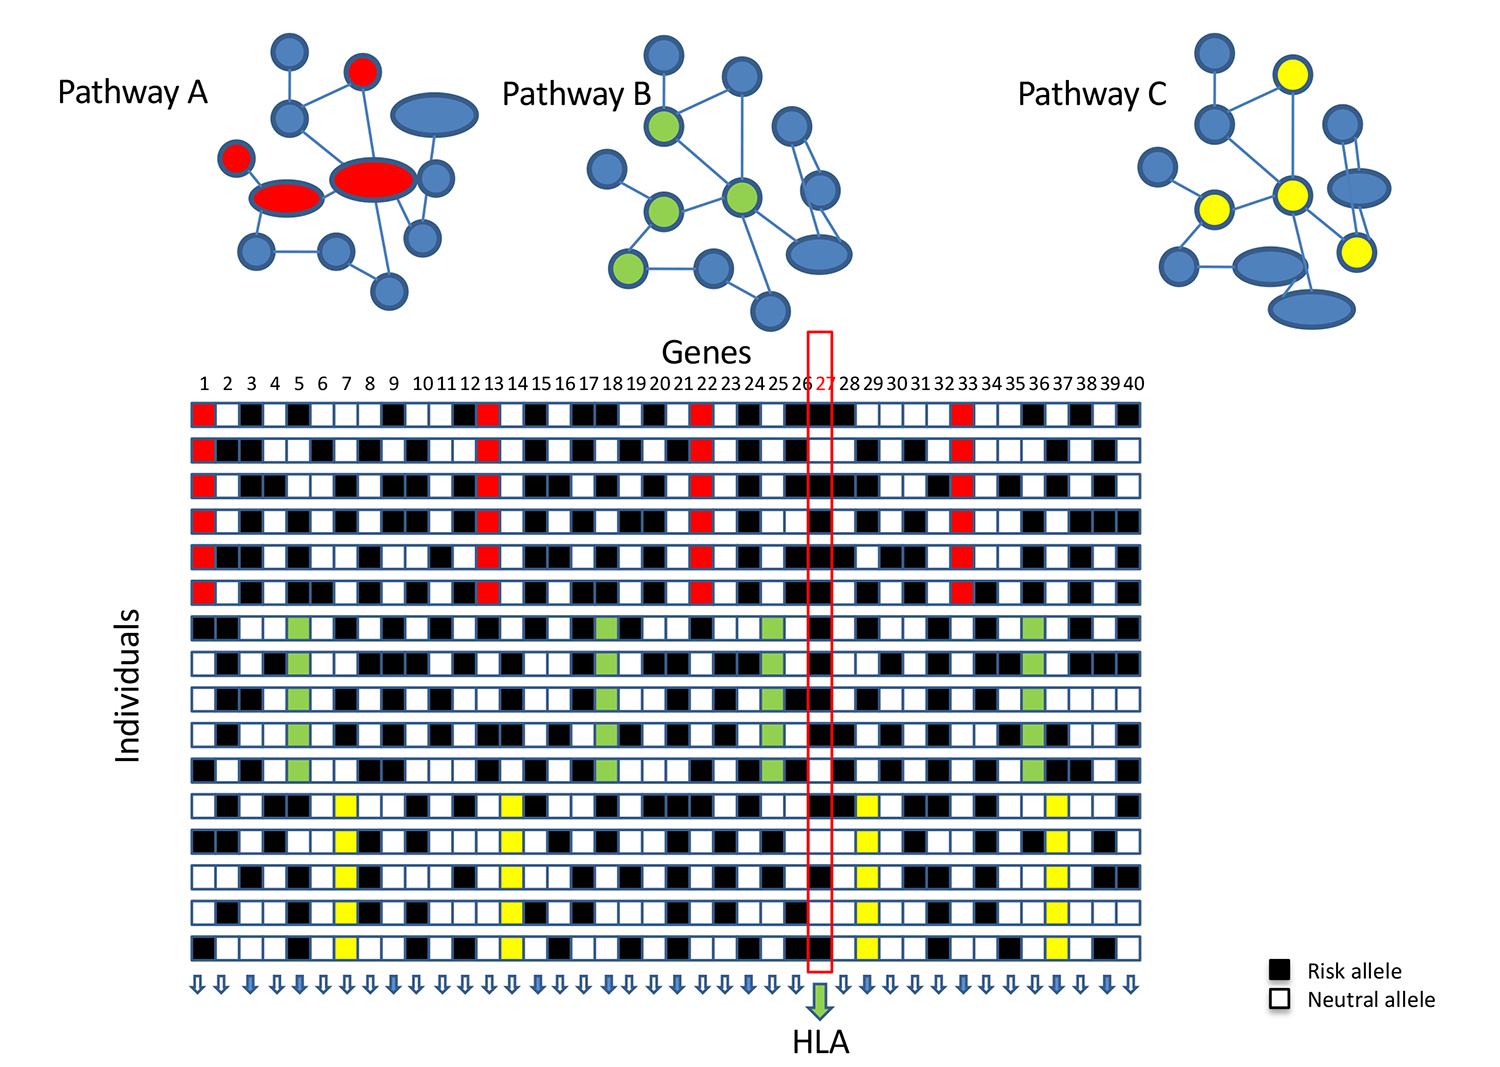
Pathway Analysis
We developed a novel bioinformatics and network-based pipeline where the most functionally associated gene per region and cell type are identified, leveraging multiple sources of evidence including ENCODE and Roadmap Epigenomics Project. This method is relevant for the prioritization of genes within a region, and for individualized risk stratification—where networks of associated genes in different cell types can be potentially used to inform therapeutic approaches or disease management strategies.
This novel approach will open new avenues to integrate past and future GWA studies with publicly available regulatory information and shines more light on the functional aspects of disease etiology and on the use of individual genetic scores to discover associations with additional phenotypes.